|
Features |
|
This page introduces the main
features of ATRISCAL. |
|
Radial Map |
|
A
radial map is a lost style of map that has been brought back to life by ATRISCAL. The red points in the figure are the reproduced
coordinates of each item. The orange points are the intersections where the
straight lines connecting the origin to the red points pass through the
surface of a hemisphere.
In
a radial map, the orange points of the items with a higher correct response
rate are placed closer to the summit of the hemispherical dome. Conversely,
items with a lower correct response rate are arranged more horizontally with
respect to the XY plane, and the coordinates of the orange points are
arranged closer to the equator of the dome. In addition, each item is
arranged in such a way that it comes underneath the items on which the item
is dependent. |
|
Topographic Map |
|
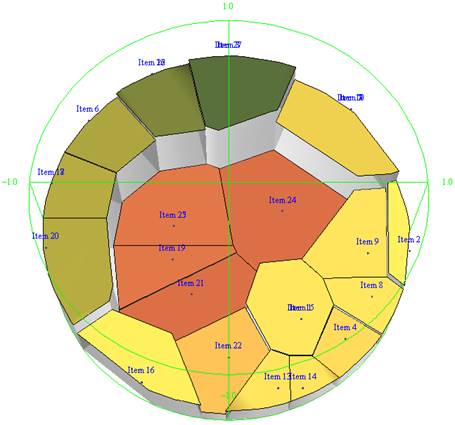
A
topographic map is based on a radial map but is used to provide more of a
visual understanding of the dependencies between items. First, the orange
points of the radial map are projected onto the XY plane. Next, Voronoi
partitioning is applied to these projected points. Finally, each Voronoi cell
is lifted by a distance corresponding to the length of the orange line
segment in the radial map (which more or less corresponds to the difficulty
of the item).
In a topographic map, items with a lower correct
response rate are placed closer to the center of the circle, and items with a
higher correct response rate are placed closer to the circumference.
Furthermore, each item is placed further from the items on which the item is
dependent. Compared with a radial map, a topographic map is more suitable for
visualizing the dependency relationships between items. |
|
Mastery Map |
|
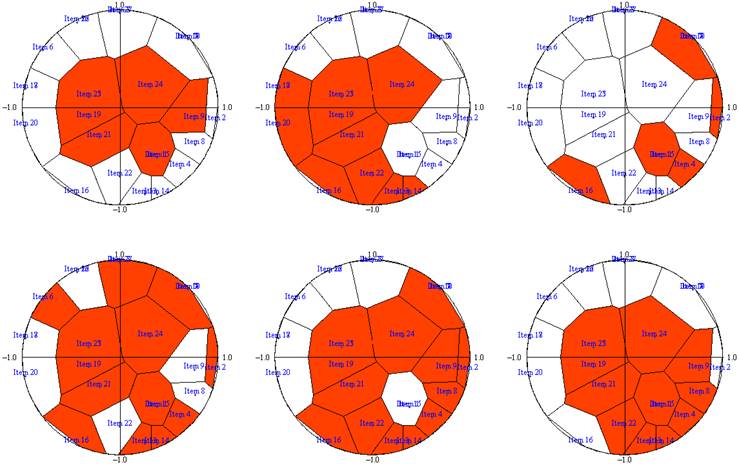
A
mastery map is obtained for each examinee. The Voroni
cells in the topographic map are colored differently depending on whether
they correspond to items that the examinee answered correctly or incorrectly.
For example, the examinee at the
top left was only able to answer simple questions correctly, and has a low
level of academic ability. The cluster of red cells at the center of the map
demonstrates this low level of ability. Conversely, for a student that was
able to answer all the items correctly, all the cells would be colored in.
The more the region of colored cells grows outwards from the center of the
circle to the circumference, the greater the academic ability of the
examinee. The mastery map at the top center seems to indicate a lower level
of mastery than the map at the bottom left, but also indicates a lack of
practice regarding the academic areas from the top round to the right side of
the map. Mastery maps can take many different forms depending on the
distribution of correct and incorrect responses from each individual. |